Supplementary Graphics and Information for my GSA2021 Presentation on SWB in India
Short link back to this page, for sharing:
erka.me/Ind
Who Needs a Friend?
How Age and Having Someone one can Count on Explain Subjective Well-Being in India
Click the buttons to access the poster and accompanying voiceover, which presents/walks through the poster highlights.
We were strongly encouraged to use the #betterposter format for this conference. I tried really hard to adhere to the #betterposter rules and to the additional rules written into the provided template note sections, but I’m afraid I couldn’t quite satisfy all of them. One set of rules said to use less text, more images. Another set of rules said, “no images except in the right column.” In sum, I feel that my poster is a 50% #betterposter (?). I tried.

What is subjective well-being?
Short answer: Subjective well-being is an umbrella term generally conceived of as how someone feels about their own life.
A bit more on this: It is most often thought of as a combination of three distinct yet related dimensions or separate measures of well-being: positive affect, negative affect, and a cognitive appraisal (Diener, 1984; Jebb et al., 2020; OECD, 2013; Stone and Mackie, 2013). The cognitive appraisal reflects the evaluative well-being or “life evaluation” principally at focus in the present study. Affective well-being is thought of as more malleable, reflective of mood and current circumstances, whereas evaluative well-being is more durable over time and unlikely to change from day to day.
How is subjective well-being measured?
Short answer: By systematically asking the people of the world how they’re doing.
Longer answer: Subjective well-being can be measured in many ways. In the present study, the outcome measure is the Life Evaluation Index from the Gallup World Poll. The Life Evaluation Index is primarily based on an average of the present and future-looking evaluative well-being questions (the self-anchoring Cantril ladder scale questions, for those familiar). According to OECD guidelines (OECD, 2013), a single, present-oriented Cantril ladder question is an adequate measure of subjective well-being if only one question is going to be used, although Gallup has several subjective well-being items. The Life Evaluation Index is also informed by affective well-being and related measures, particularly in terms of determining cut-points for the 3-point ordered Life Evaluation Index.
The value of the Life Evaluation Index measure from Gallup is that it is based on questions that have been asked around the globe in most countries, in nationally-representative samples, carefully translated into native languages, and asked the same way since the first Gallup World Poll in 2006. This gives us a vantage point both for looking within a country and for looking around among them. The present-oriented Cantril ladder question from the Gallup World Poll is also the basis of the World Happiness Report‘s annual rankings of nations, published by the Sustainable Development Solutions Network in partnership with many others. While India’s rankings are similar on that one question as they are on the Life Evaluation Index, the latter was chosen for this study because it is a more inclusive, fuller well-being measure.
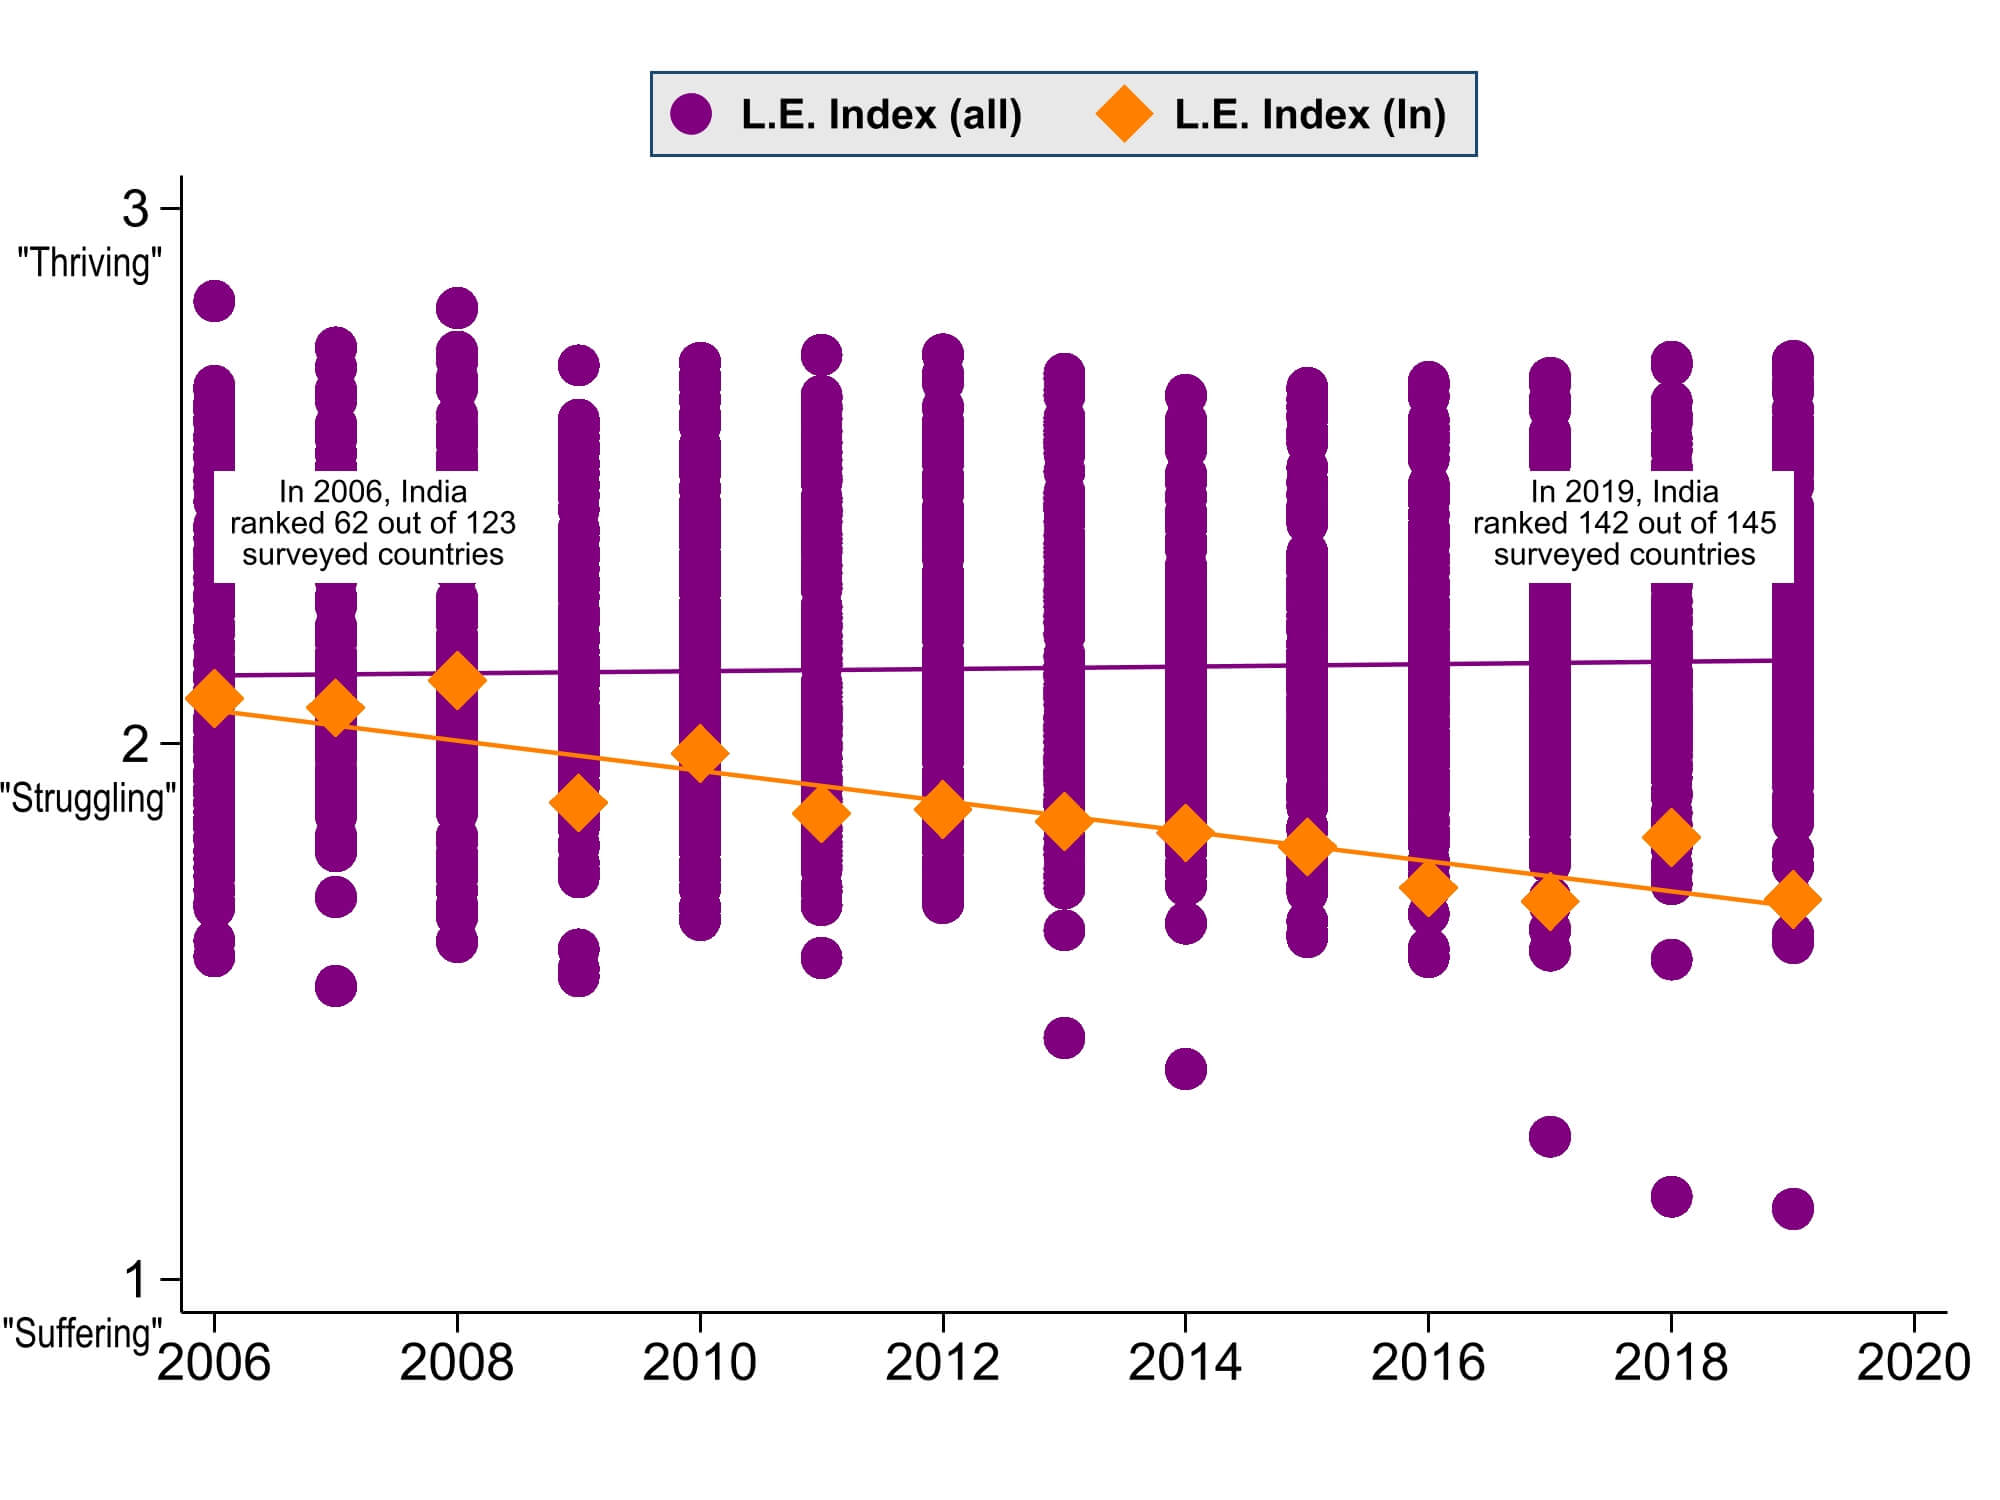
What is the subjective well-being situation in India overall?
Subjective Well-Being Around the World, and Ranking India per GWP Life Evaluation Index
2006-2019
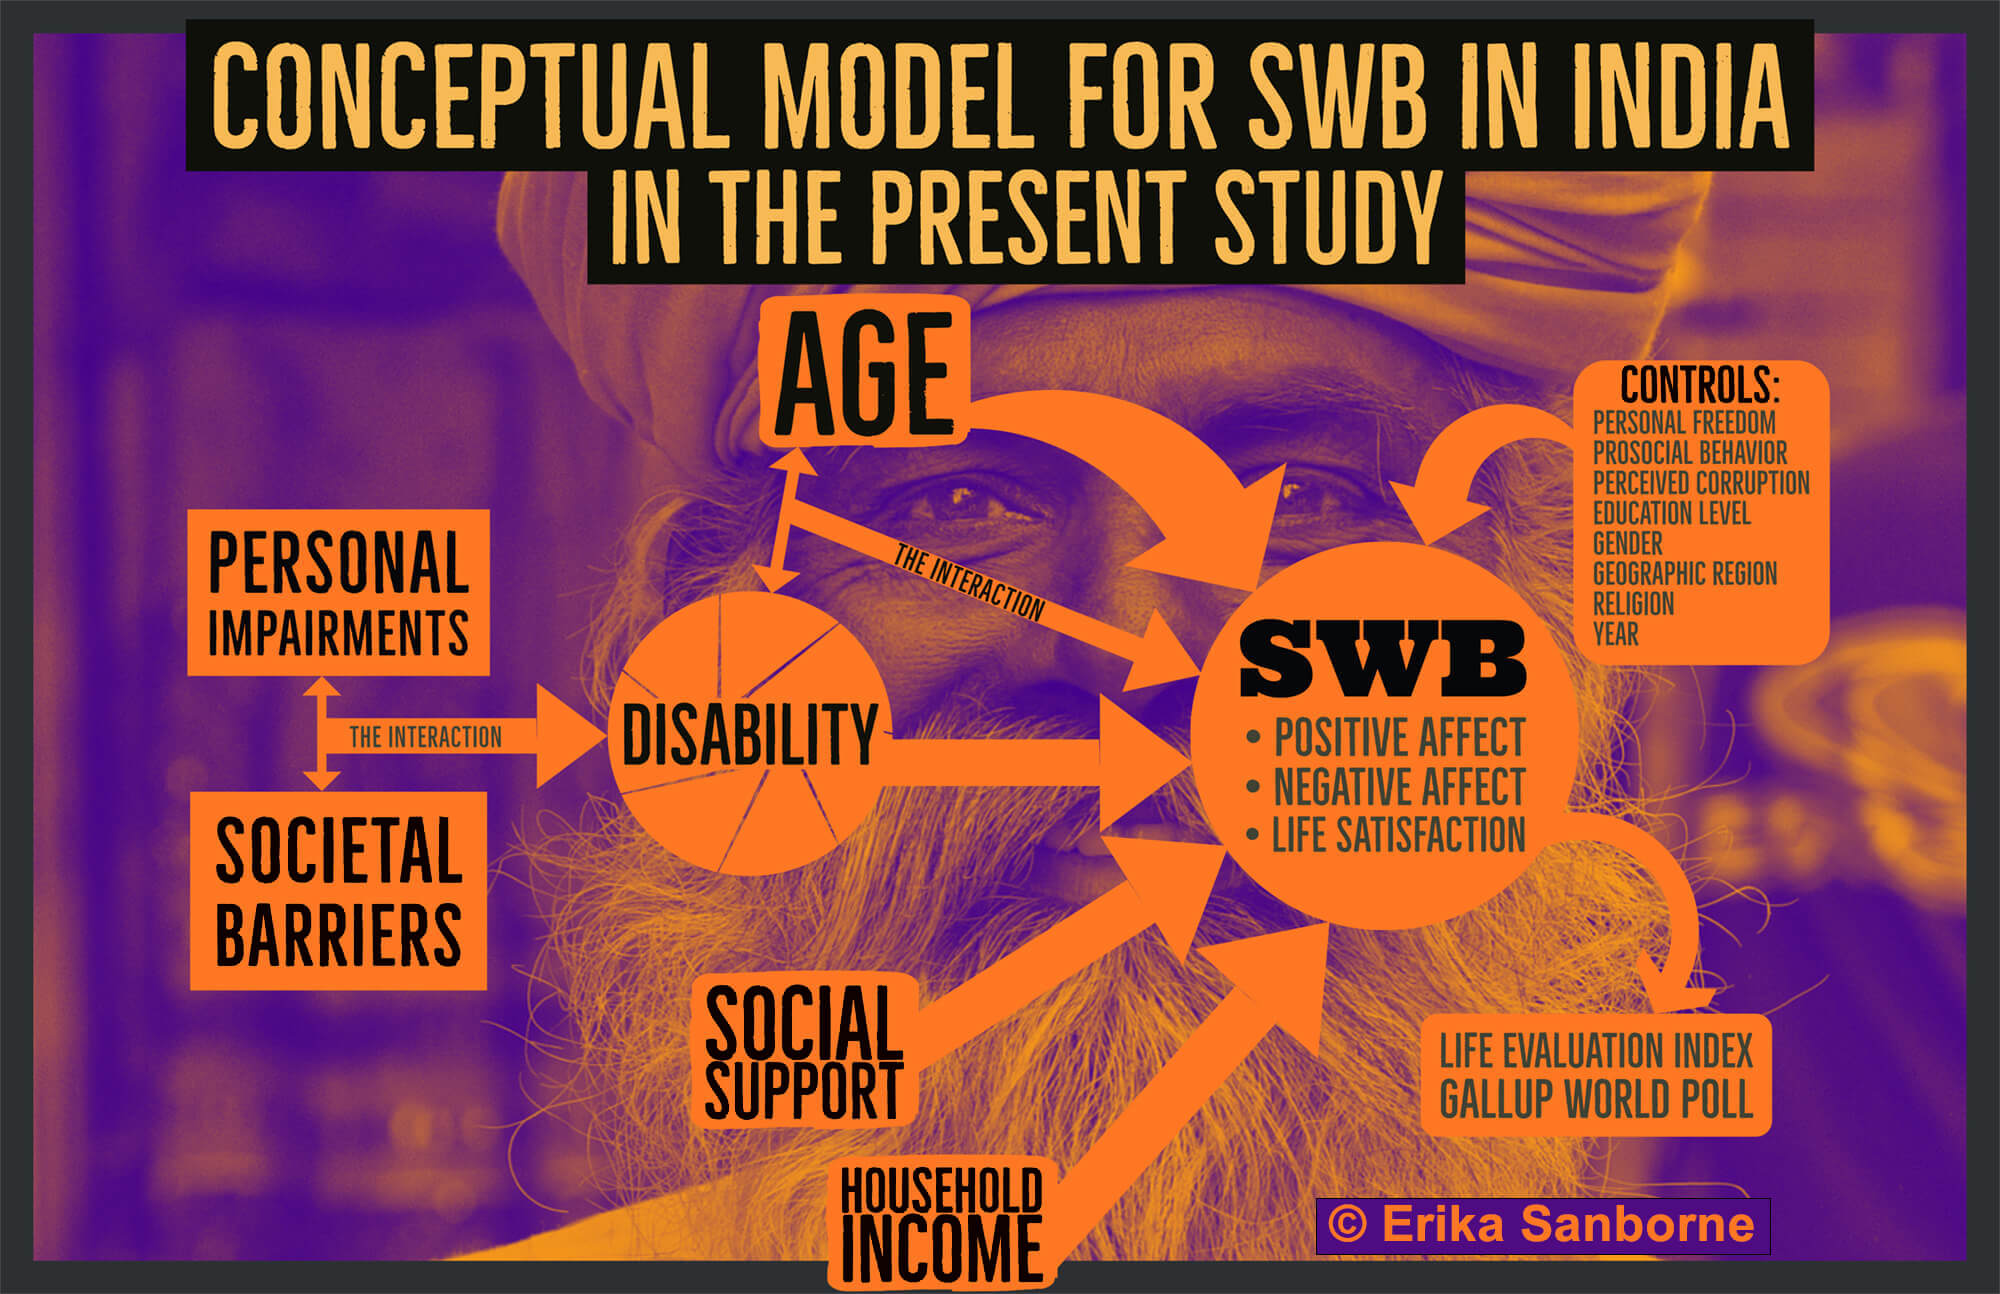
What is the conceptual model grounding the present study?
What do we usually expect to predict subjective well-being? What explains who is thriving, struggling, or suffering, in general?
Short-ish answer: The scientists behind the World Happiness Report analyzed this question for the entire world. In 2020, they determined that “six key variables contribute to explaining the full sample of national annual average (Cantril ladder) scores over the whole period 2005-2019. These variables are GDP per capita, social support, healthy life expectancy, freedom, generosity, and absence of corruption” (World Happiness Report 2020, p.14).
Short fun fact: They also looked at how much each of these six variables contributed to variation in life evaluation scores. They found, for the world as a whole, that “the largest single part (33%) comes from social support, followed by GDP per capita (25%) and healthy life expectancy (20%), and then freedom (13%), generosity (5%), and corruption (4%)” (World Happines Report 2020, p.18).
Longer answer: When modeling something at the level of humankind, by aggregating respondent-level data, extremes will tend to cancel one another out, and nuance necessarily gets lost in order for broad patterns to emerge, and the story of the world cannot possibly be the identical story of any one country. The present study models subjective well-being based largely on these expected or known predictors of it, while also considering what makes India unique. Life expectancy for example stands out, because India’s life expectancy has increased impressively over the past three decades.
Such a remarkable improvement in human life expectancy would normally be accompanied by an increase in subjective well-being, and yet it was not. What could explain that? What is the role of health problems or, better framed, disability, socially-defined? What is the role of access to adequate healthcare in determining subjective well-being in India today?
Combining the generally-accepted known predictors of subjective well-being, with the current situation in India, the present study models subjective well-being based on these predictors, with the key predictors in bold type:
– household income
– social support
– age
– disability (and its interaction with age)
– generosity (I call it prosocial behavior)
– freedom
– corruption
– education, gender, region, and religion.
What is the final, best-fitting regression model from this study?
Short answer: A partial proportional odds (PPO) model. I fit the model using the gologit2 user-written program for Stata (Williams, R. 2016).
Longer answer:

Where:
|
i = |
an individual survey respondent |
|
Yi = |
SWB outcome category for respondent i |
|
j = |
1, 2 = (SWB outcome categories – 1) |
αj = |
the set of constants from all j models |
|
Xi = |
the set of that respondent’s scores on all x1-x11 variables in the model |
|
βj = |
the set of coefficients for that predictor or control variable at the respondent’s SWB level; for variables where the proportional odds assumption was held, that coefficient is independent of outcome level and does not vary by j. Each respondent i has their own independent multinomial distribution |
//I cleaned the data first and renamed variables
//I am using Stata 16.1 SE.
svyset [pweight=wgt]
//best final ppo/gologit model for 2009
gsvy: gologit2 WB c.logincome i.socialsup c.logage##i.disability i.prosocial i.freedom ///
i.education i.corruptind i.gender i.region i.hindu if year==2009, ///
autofit force
eststo ppo2009
gsvy: gologit2 WB c.logincome i.socialsup c.logage##i.disability i.prosocial i.freedom ///
i.education i.corruptind i.gender i.region i.hindu if year==2019, ///
autofit force
eststo ppo2019
/* References
     Gallup (2021). Gallup World Poll [The_Gallup_101521.dta]. Washington, DC, Gallup.
     Jann, Ben (2013). COEFPLOT: Stata module to plot regression coefficients and other results. Available from http://ideas.repec.org/c/boc/bocode/s457686.html.
     Williams, Richard (2016). GOLOGIT2: Understanding and interpreting generalized ordered logit models. The Journal of Mathematical Sociology, 40:1, 7-20, http://www.tandfonline.com/doi/full/10.1080/0022250X.2015.1112384. */
Gologit2/ppo model coefficients for SWB in India in 2009 and 2019 compared

The previous coefplot is in place of a traditional regression table, because this is a website, not a paper, and graphics more readily convey information than do tables stuffed with small font numbers. For those who love such things, you can see the numbers you want in the coefplot as well, I promise. Here is a full coefplot showing all 12 terms in the model, if interested, also plotting P(Yi>suffering).
Great. How about AMEs?
Yes! Average marginal effects plots, coming right up. Please keep in mind that, because of how averages work, this too masks nuance that is key to interpreting findings. It’s a great starting point, but don’t stop at the AME plot please.

If you’d like to “zoom in” on the AMEs for disability and log-age in 2019, see here.
A few things to notice in the AME plots above? Focusing on the 2019 AMEs, two variables significantly reduce the probability of suffering: log-income, and social support. And there is one variable that significantly increases the probability of suffering, log-age. Age increases probability of suffering by about 5 percentage points on average (95%CI: 2-8 percentage points) in 2019.
We can better understand that range in the next plot.

Interesting, right? Looking at the 2019 predictive margins, for logage-disability interaction, notice the purple circles, which represent “suffering” (the lowest of the three categorical outcomes. Do you see the 2-8 percentage point range? Who is likely experiencing the 8 percentage point increase in probability of suffering? (The oldest people with disabilities.)
So look at the AME plot again. Where are there signs of hope? What decreased the probability of suffering in 2019? Two things:
income: a standard deviation increase in log-transformed household income (equivalent of a household going from 55,000 to 140,000 rupees/year). That decreased the probability of suffering by 17 percentage points.
social support: having a friend, someone to count on in times of trouble. That alone decreased the probability of suffering by 11 percentage points.
FAQs
Closing Thoughts?
“Who needs a friend?” Anyone whose household income you cannot triple, and whose probability of suffering you’d prefer to reduce. As you can see in the plots, there is not a lot of thriving in India right now. Hence, reduction in suffering is a fair goal. Both income and social support can help considerably.
There is that other matter of the age-disability interaction, and it seems to suggest a need for increased national spending on healthcare, consistent with both the World Health Organization’s recommendations for India, and what the Indian government themselves claimed in early 2021. More on that in my forthcoming publication.
Thanks for being here. What do you think? I welcome your responses and questions either by email or in the comments below.
Research presented herein and reported in the related upcoming publication has benefited from support provided by the Minnesota Population Center (Award number P2CHD041023), which receives funding from the Eunice Kennedy Shriver National Institute of Child Health and Human Development, and by the University of Minnesota Life Course Center on the Demography and Economics of Aging (P30AG066613), funded through a grant from the National Institute on Aging. #NIAFundsMe